|
| |
Simple Properties
A simple property is one that takes a single
value. The percent property
in the BarChart bean is a
simple property.
Simple Property Naming Patterns
The naming pattern for simple properties is any pair of
methods with the signatures:
public Type getPropertyName() public void setPropertyName(Type t)
which exports a read/write
simple property PropertyName, of
type Type.
A get
method without a corresponding set method
exports a read-only property.
Indexed Properties
An indexed property is one whose value is an array.
Indexed Property Naming Patterns
The naming pattern for indexed properties is any pair of
methods with the signatures:
public Type[] getPropertyName() public void setPropertyName(Type[] t)
which exports a read/write
indexed property PropertyName, of
type Type[].
For example, a Bean that implements a graphical chart, might
have methods:
public double[] getValues() public void setValues(double[] values)
which export a read/write
indexed property values,
of type double[].
The values could be the values being graphed.
A get
method without a corresponding set method exports
a read-only indexed property.
Individual elements in the indexed property array may be
got and set, using methods with the following signatures:
public Type getPropertyName(int index) public void setPropertyName(int index, Type t)
where index is the
(0-based) index into the array. Since these methods index
into the array of property values, it is possible for an ArrayIndexOutOfBoundsException to
occur. Therefore, you may declare them as follows, if you
wish:
public Type getPropertyName(int index)
	throws ArrayIndexOutOfBoundsException
public void setPropertyName(int index, Type t)
throws ArrayIndexOutOfBoundsException
(Note that ArrayIndexOutOfBoundsException
is a RuntimeException, and so
is unchecked; consequently, you don't have to declare it,
even if the method can throw it.)
Indexed Properties in the BeanBox
The BeanBox doesn't support indexed properties at this
point, so we have to provide a way of setting these
ourselves. We'll be discussing this later.
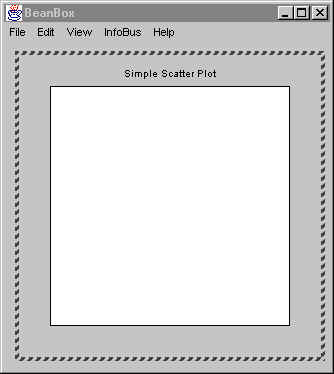
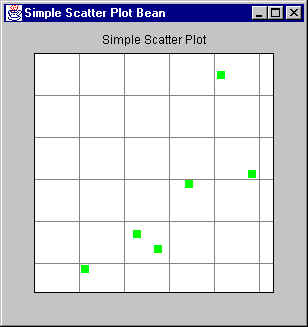
Example: A SimpleScatterPlot Bean
Here's an example that shows the use of both simple and
indexed properties -- Simple Scatter Plot bean. Here's what
it looks like when enclosed in a Frame:
The code for the Bean is as follows. It's rather long. You
don't really have to study the paint()
method and other related methods. Instead, concentrate on the
get/set methods for now.
package javaBeans;

import java.awt.Canvas;
import java.awt.Color;
import java.awt.Dimension;
import java.awt.Graphics;
import java.awt.Point;
import java.awt.Rectangle;

import java.util.Random;

/**
 *  A class that implements a simple scatter plot Java Bean.
 *
 *  @author Bryan J. Higgs, 6 April 2000
 */
public class SimpleScatterPlot extends Canvas
{
    /**
    *   Constructor
    */
    public SimpleScatterPlot()
    {
        m_title = "Simple Scatter Plot";
        setBackground(Color.lightGray);
    }

    //// Set/get properties ////

    /**
    *   Gets the array of points being displayed.
    */
    public Point[] getPoints()
    {
        return m_points;
    }

    /**
    *   Sets the array of points to be displayed.
    *   Causes the display to be automatically refreshed.
    */
    public void setPoints(Point[] points)
    {
        m_points = points;
        m_autoRangingDone = false;
        repaint();
    }

    /**
    *   Gets the i-th (0-based) point being displayed.
    *   @return the Point, or null if the index is out of range.
    */
    public Point getPoints(int i)
    {
        Point p = null;
        if (m_points != null && i >= 0 && i < m_points.length)
            p = m_points[i];
        return p;
    }

    /**
    *   Sets the i-th point being displayed.
    *   If i represents one of the existing points, it is replaced.
    *   If i represents a point immediately after the last point,
    *   then it is added to the end, becoming the new last point.
    *   Otherwise, an IllegalArgumentException is thrown.
    */
    public void setPoints(int i, Point p)
    {
        if (m_points != null)
        {
            int currentSize = m_points.length;
            if (i >= 0 && i < currentSize)
            {
                // Replace an existing point
                m_points[i] = p;
                m_autoRangingDone = false;
                repaint();
                return;
            }
            else if (i > currentSize)
            {
                // We can't add this, since it would
                // create a null entry.
                throw new IllegalArgumentException();
            }
        }

        // Add a new point
        addPoint(p);
    }

    /**
    *   Adds a point to the existing array of points to be displayed.
    */
    public void addPoint(Point p)
    {
        if (m_points == null)
        {
            m_points = new Point[1];
            m_points[0] = p;
        }
        else
        {
            int currentSize = m_points.length;
            Point[] newArray = new Point[currentSize+1];
            System.arraycopy(m_points, 0,   // from
                                newArray, 0,   // to
                                currentSize    // size
                            );
            m_points = newArray;
            m_points[currentSize] = p;
        }

        m_autoRangingDone = false;
        repaint();
    }

    /*
    *   Gets the number of points currently being displayed.
    */
    public int getPointCount()
    {
        int count = 0;
        if (m_points != null)
            count = m_points.length;
        return count;
    }

    /**
    *   Gets the scatter plot title.
    */
    public String getTitle()
    {
        return m_title;
    }

    /**
    *   Sets the scatter plot title.
    *   Refreshes the display.
    */
    public void setTitle(String title)
    {
        m_title = title;
        repaint();
    }

    /**
    *   Gets the current title text color.
    */
    public Color getTitleColor()
    {
        return m_titleColor;
    }

    /**
    *   Sets the title text color.
    *   Refreshes the display.
    */
    public void setTitleColor(Color color)
    {
        m_titleColor = color;
        repaint();
    }

    /**
    *   Gets the current plot background color.
    */
    public Color getPlotBackColor()
    {
        return m_plotBackColor;
    }

    /**
    *   Sets the plot background color.
    *   Refreshes the display.
    */
    public void setPlotBackColor(Color color)
    {
        m_plotBackColor = color;
        repaint();
    }

    /**
    *   Gets the current point display color.
    */
    public Color getPointColor()
    {
        return m_pointColor;
    }

    /**
    *   Sets the point display color.
    */
    public void setPointColor(Color color)
    {
        m_pointColor = color;
        repaint();
    }

    /**
    *   Gets the current grid color.
    */
    public Color getGridColor()
    {
        return m_gridColor;
    }

    /**
    *   Sets the grid color.
    *   Refreshes the display.
    */
    public void setGridColor(Color color)
    {
        m_gridColor = color;
        repaint();
    }

    /**
    *   Gets the current plot bounds.
    */
    public PlotBounds getPlotBounds()
    {
        return m_bounds;
    }

    /**
    *   Sets the plot bounds.
    *   Refreshes the display.
    */
    public void setPlotBounds(PlotBounds bounds)
    {
        m_bounds = bounds;
        m_autoRangingDone = false;
        repaint();
    }

    /**
    *   Gets whether autoranging is turned on for the x direction.
    */
    public boolean isAutoRangeX()
    {
        return m_autoRangeX;
    }

    /**
    *   Sets autoranging on or off for the x direction.
    *   Refreshes the display.
    */
    public void setAutoRangeX(boolean autoRangeX)
    {
        m_autoRangeX = autoRangeX;
        m_autoRangingDone = false;
        repaint();
    }

    /**
    *   Gets whether autoranging is turned on for the y direction.
    */
    public boolean isAutoRangeY()
    {
        return m_autoRangeY;
    }

    /**
    *   Sets autoranging on or off for the y direction.
    *   Refreshes the display.
    */
    public void setAutoRangeY(boolean autoRangeY)
    {
        m_autoRangeY = autoRangeY;
        m_autoRangingDone = false;
        repaint();
    }

    /**
    *   Gets whether the gird should be shown.
    */
    public boolean isShowGrid()
    {
        return m_showGrid;
    }

    /**
    *   Sets the display of the grid on or off.
    *   Refreshes the display.
    */
    public void setShowGrid(boolean showGrid)
    {
        m_showGrid = showGrid;
        repaint();
    }

    /**
    *   Sets the preferred size for the scatter plot canvas.
    */
    public Dimension getPreferredSize()
    {
        if (m_preferredSize == null)
            m_preferredSize = new Dimension(300, 300);
        return m_preferredSize;
    }

    /**
    *   Sets the preferred size for the scatter plot canvas.
    *   Refreshes the display.
    */
    public void setPreferredSize(Dimension d)
    {
        m_preferredSize = d;
        repaint();
    }

    /**
    *   Paints the scatter plot canvas.
    */
    public void paint(Graphics g)
    {
        // Get information necessary to paint
        Dimension size = getSize();
        int width = size.width;
        int height = size.height;

        paintTitle(g, width, height);

        autoRange();

        // Create a new clipped area to draw the actual plot into.
        Graphics area =
                g.create((int)((width/10.0)+0.5),
                            (int)((height/10.0)+0.5),
                            (int)((width * 8.0 / 10.0) + 0.5),
                            (int)((height * 8.0 / 10.0) + 0.5)
                        );

        plotPoints(area);

        if (isShowGrid())
            paintGrid(area);

        // Draw rectangle around the plot
        Rectangle rect = area.getClipBounds();
        area.setColor(Color.black);
        area.drawRect(0, 0,  rect.width-1, rect.height-1);
    }

    //// Protected methods ////

    /**
    *   Paints the title text.
    */
    protected void paintTitle(Graphics g, int width, int height)
    {
        // Baseline at 7% from top
        int baseline = height * 7 / 100;
        int titleWidth = getFontMetrics(getFont()).stringWidth(m_title);
        int xStart = (width - titleWidth) / 2;

        if (xStart < 0)
            xStart = 0;

        g.setColor(m_titleColor);
        g.drawString(m_title, xStart, baseline);
    }

    /**
    *   Determines and sets the bounds from the set of points being displayed.
    */
    protected void autoRange()
    {
        // If there are points, and we're autoranging, do the work...
        // (If autoranging has been done, don't bother doing it again.)
        if (m_points != null &&
            !m_autoRangingDone &&
            (m_autoRangeX || m_autoRangeY)
           )
        {
            if (m_autoRangeX)
            {
                m_bounds.setXMin(m_points[0].x);
                m_bounds.setXMax(m_points[0].x);
            }
            if (m_autoRangeY)
            {
                m_bounds.setYMin(m_points[0].y);
                m_bounds.setYMax(m_points[0].y);
            }
            for (int i = 1; i < getPointCount(); i++)
            {
                if (m_autoRangeX)
                {
                    if (m_points[i].x < m_bounds.getXMin())
                        m_bounds.setXMin(m_points[i].x);
                    if (m_points[i].x > m_bounds.getXMax())
                        m_bounds.setXMax(m_points[i].x);
                }
                if (m_autoRangeY)
                {
                    if (m_points[i].y < m_bounds.getYMin())
                        m_bounds.setYMin(m_points[i].y);
                    if (m_points[i].y > m_bounds.getYMax())
                        m_bounds.setYMax(m_points[i].y);
                }
            }

            m_autoRangingDone = true;
        }
    }

    /**
    *   Plots the points on the scatter plot.
    */
    protected void plotPoints(Graphics g)
    {
        Rectangle rect = g.getClipBounds();

        // Set window for graphics
        int height = rect.height;
        int width = rect.width;

        // Fill background
        g.setColor(m_plotBackColor);
        g.fillRect(0, 0, width-1, height-1);

        Point thePoint;
        for (int i = 0; i < getPointCount(); i++)
        {
            thePoint = getPoints(i);

            // Figure out where the point goes.
            // If autoscaling is on along one axis, we extend
            // the scale by 10% so points don't end up
            // being cut off by the graph edges.
            double dyExpand = m_autoRangeY ? 1.1 : 1.0;
            int y = height -
              (int)(height * thePoint.y / (m_bounds.getYMax() * dyExpand));

            double dxExpand = m_autoRangeX ? 1.1 : 1.0;
            int x =
              (int)(width * thePoint.x / (m_bounds.getXMax() * dxExpand));

            // Draw points.
            g.setColor(m_pointColor);
            g.fillRect(x-4, y-4, 8, 8); // Draw a colored rectangle 'point'.
        }
    }

    /**
    *   Paints the scatter plot grid.
    */
    protected void paintGrid(Graphics g)
    {
        Rectangle rect = g.getClipBounds();
        if (!m_showGrid)
            return;

        // Set window for graphics
        int height = rect.height;
        int width = rect.width;

        if (m_xTic == 0)
            m_xTic = ((m_bounds.getXMax() - m_bounds.getXMin()) / 5);
        if (m_xTic == 0)
            m_xTic = 10;

        if (m_yTic == 0)
            m_yTic = ((m_bounds.getYMax() - m_bounds.getYMin()) / 5);
        if (m_yTic == 0)
            m_yTic = 10;

        // Draw x grid lines
        g.setColor(m_gridColor);

        int xRange = m_bounds.getXMax() - m_bounds.getXMin();
        if (xRange == 0)
            xRange = 100;
        double xPixPerUnit = width/xRange;

        for (int xval = 0; xval <= m_bounds.getXMax(); xval += m_xTic)
        {
            int xpos = (int)(xval * xPixPerUnit);
            g.drawLine(xpos, 0, xpos, height);
        }

        // Draw y grid lines
        int yRange = m_bounds.getYMax() - m_bounds.getYMin();
        if (yRange == 0)
            yRange = 100;
        double yPixPerUnit = height/yRange;

        for (int yval = 0; yval <= m_bounds.getYMax(); yval += m_yTic)
        {
            int ypos = (int)(yval * yPixPerUnit);
            g.drawLine(0, ypos, width, ypos);
        }
    }

    //// Private data ////

    private String          m_title;
    private Point           m_points[];
    private PlotBounds      m_bounds = new PlotBounds(0, 0, 0, 0);
    private boolean         m_showGrid = true;
    private boolean         m_autoRangeY = true;
    private boolean         m_autoRangeX = true;

    private Color           m_titleColor = Color.black;
    private Color           m_plotBackColor = Color.white;
    private Color           m_pointColor = Color.green;
    private Color           m_gridColor = Color.gray;

    private int             m_xTic = 0;
    private int             m_yTic = 0;

    private Dimension       m_preferredSize;
    private boolean         m_autoRangingDone = false;
}
|
Here is the PlotBounds class that it uses:
package javaBeans;

/**
*   A class to represent the bounds of a scatter plot.
*
*   @author Bryan J. Higgs, 6 April, 2000
*/
public class PlotBounds
{
    /**
    *   Constructor
    */
    public PlotBounds(int xMin, int yMin, int xMax, int yMax)
    {
        m_xMin = xMin;
        m_yMin = yMin;
        m_xMax = xMax;
        m_yMax = yMax;
    }

    public int getXMin()
    {
        return m_xMin;
    }

    public void setXMin(int x)
    {
        m_xMin = x;
    }

    public int getYMin()
    {
        return m_yMin;
    }

    public void setYMin(int y)
    {
        m_yMin = y;
    }

    public int getXMax()
    {
        return m_xMax;
    }

    public void setXMax(int x)
    {
        m_xMax = x;
    }

    public int getYMax()
    {
        return m_yMax;
    }

    public void setYMax(int y)
    {
        m_yMax = y;
    }

    //// Private Data ////
    private int m_xMin = 0;     // The minimum x value
    private int m_yMin = 0;     // The minimum y value
    private int m_xMax = 0;     // The maximum x value
    private int m_yMax = 0;     // The maximum y value
} |
and finally, the test program that displays it:
package javaBeans;

import java.awt.BorderLayout;
import java.awt.Frame;
import java.awt.Point;
import java.awt.event.WindowAdapter;
import java.awt.event.WindowEvent;

/**
*   A class to test the SimpleScatterPlot Java Bean.
*
*   @author Bryan J. Higgs, 6 April, 2000
*/
public class TestSimpleScatterPlot
{
    public static void main(String[] args)
    {
        Frame f = new Frame("Simple Scatter Plot Bean");
        // Create the scatter plot
        SimpleScatterPlot p = new SimpleScatterPlot();
        // Specify the set of points for it to display
        p.setPoints(m_points);
        // Add it to the Frame
        f.add(p, BorderLayout.CENTER);
        // Make the Frame respond to window closing events
        f.addWindowListener( new WindowAdapter()
            {
                public void windowClosing(WindowEvent ev)
                {
                    System.exit(0);
                }
            }
        );
        // Autosize the Frame, based on its contents.
        f.pack();
        // Finally, make it visible.
        f.setVisible(true);
    }

    //// Private Data ////

    /**
    *   The set of points to display.
    */
    private static final Point[] m_points =
    {
        new Point(10, 12),
        new Point( 5,  5),
        new Point(15, 22),
        new Point(21, 24),
        new Point(12,  9),
        new Point(18, 44)
    };
} |
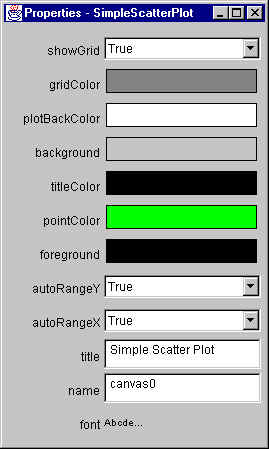
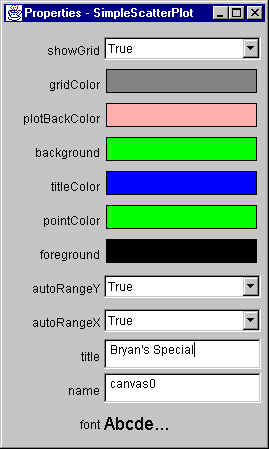
If you add the SimpleScatterPlot bean to the BeanBox,
you'll see the following:
As you can see, the BeanBox found a number of properties:
- showGrid
- gridColor
- plotBackColor
- titleColor
- pointColor
- autoRangeX
- autoRangeY
- title
All these come from the SimpleScatterPlot
bean. However, it also found the following properties:
- background
- foreground
- name
- font
Where did these all come from? From the SimpleScatterPlot's superclasses,
in particular, java.awt.Component.
We'll be talking more about this, later.
It did not, however, show the following properties:
- points, because it is
an indexed property, and its type is not displayable
- pointCount, because
it is a read-only property.
- plotBounds, because
its type is not displayable
- preferredSize,
because its type is not displayable
If you look at what the BeanBox outputs when it activates
the Bean, you'll see something like:
...
Warning: Can't find public property editor for property "preferredSize".  Skipping.
Warning: Can't find public property editor for property "plotBounds".  Skipping.
one warning for each such property.
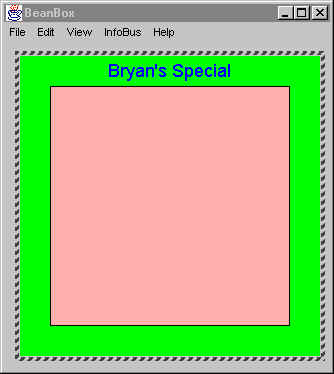
Back in the BeanBox, if you play with changing the
properties for this bean, you can see something like the
following:
Pretty garish color scheme, huh?
Note that the Bean's display changes when a property
changes at design time, because that's the way I coded it --
take a look at all the calls to refresh() in the set methods.
If you don't do this, it won't redisplay.
|