|
| |
Drawing Shapes: Generalizing the Problem
In this section, you'll write a program that displays the data
in a histogram form, like this:
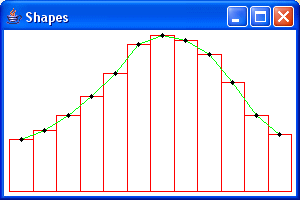
with the same resizing behavior as before:
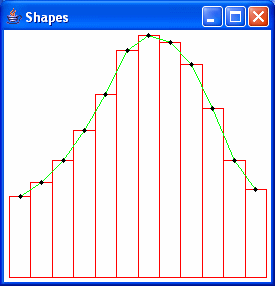
In other words:
- display the original points (in black)
- display green lines connecting the points
- display the data in the form of a histogram by drawing
red rectangles
Because we're displaying rectangles based at the x axis (where y = 0), we're
including a larger region of world coordinate space, so the points appear to
move upward in the window, compared with the results of the
last part of this assignment.
We'll be using inheritance and polymorphism to simplify the
job. We've done all the hard work in Part A -- this should be
quite a bit simpler, if you've done things properly in Part A.
To implement this, you will need refer to the Specification
again; we'll be implementing more of the classes specified therein.
Here's What To Do:
- Write the
shapes.Line and
shapes.Rectangle
classes.
Bear in mind:
- Both
Line
and Rectangle
will extend class Shape.
- Ignore the
FilledRectangle
class; that will be used in the next section.
- Augment your
ShapesTest
class to use the above classes to produce the above
results.
Once you've implemented these classes, and augmented the ShapesTest
class appropriately, you should see results like the above images.
How will you draw the histogram?
Hints:
- Note that the points are all spaced evenly in the x direction,
so you can figure out the width of each rectangle quite easily
from the x coordinates of the points. Each point should be
centered in its corresponding rectangle. The height of the
rectangle should be determined by recognizing that the base of the
rectangle is on the x axis (where y = 0), and the top of the
rectangle should intersect with the corresponding point.
- Think about the order in
which you need to draw the three sets of
graphical objects so that they display correctly. This
will be reflected in how you specify the shapes in your
m_shapes
array in the ShapesTest class.
- You should not have to
change any of the classes
implemented in Part A in order to get this to
work. If you think you must make a change to
them, you're probably doing something wrong! Try to figure
out what you did wrong, and correct it, highlighting what
you changed. I want to see what you did to make this work!
-
Write the shapes.FilledRectangle
class
Here, we will modify your program to display the histogram slightly
differently:
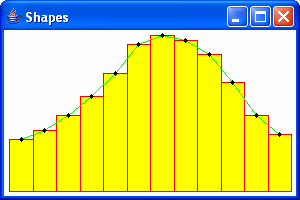
Notice that our rectangles are now filled with a different color. This is where the FilledRectangle
class comes in:
- Implement the
FilledRectangle
class, per the specification.
- Modify your
ShapesTest
class to use the FilledRectangle
class, in place of the Rectangle
class, to produce the above results.
Notes:
- There should be no need to
change any other classes to make this work.
- The implementation of
FilledRectangle should be relatively
simple. (A lot of the work is already done in the Rectangle
class.)
- The changes to
ShapesTest should be
simple -- just change the Rectangles referred to in
the m_shapes array to FilledRectangles.
-
See Whether You've Implemented Things
Correctly:
Change the contents of the m_shapes array to the following:
and see what your application displays. (You can copy out of the above
and paste it into your Java IDE, or 'Save Link/Target as...' on this
link.)
(Hint: To get the best view of this, resize your display so that it's square, rather than rectangular.)
It should display something interesting, and it should automatically
display all of the above shapes in the window (no shapes, or parts thereof,
should be outside of the display. The entire display should scale
appropriately as you resize the window. If all of these don't happen,
you need to figure out what the problem is.
|
